1. 黑盒
基本复制自https://mp.weixin.qq.com/s/DMnIC2QFE094AWU1_6ebOA
blackbox_exporter 是 Prometheus 拿来对 http/https、tcp、icmp、dns、进行的黑盒监控工具
到https://github.com/prometheus/blackbox_exporter/releases下载最新版本
常用参数
./blackbox_exporter --help
usage: blackbox_exporter [<flags>]

Flags:
  -h, --help                     Show context-sensitive help (also try --help-long and --help-man).
      --config.file="blackbox.yml"
                                 Blackbox exporter configuration file.
      --web.listen-address=":9115"
                                 The address to listen on for HTTP requests.

      --log.level=info           Only log messages with the given severity or above. One of: [debug, info, warn, error]
启动
# 默认端口为9115
nohup ./blackbox_exporter --config.file="blackbox.yml" 2>&1 &
docker启动
# 如果你不需要开 debug,请去掉最后的 --log.level=debug
docker run --rm -d -p 9115:9115 --name blackbox_exporter -v /usr/share/zoneinfo/Asia/Shanghai:/etc/localtime:ro -v /data/prometheus/blackbox_exporter/blackbox.yml:/config/blackbox.yml prom/blackbox-exporter:master --config.file=/config/blackbox.yml --log.level=debug
配置文件
# 官方默认的配置文件
modules:
  http_2xx:
    prober: http
  http_post_2xx:
    prober: http
    http:
      method: POST
  tcp_connect:
    prober: tcp
  pop3s_banner:
    prober: tcp
    tcp:
      query_response:
      - expect: "^+OK"
      tls: true
      tls_config:
        insecure_skip_verify: false
  ssh_banner:
    prober: tcp
    tcp:
      query_response:
      - expect: "^SSH-2.0-"
  irc_banner:
    prober: tcp
    tcp:
      query_response:
      - send: "NICK prober"
      - send: "USER prober prober prober :prober"
      - expect: "PING :([^ ]+)"
        send: "PONG ${1}"
      - expect: "^:[^ ]+ 001"
  icmp:
    prober: icmp
prometheus配置
http
scrape_configs:
  - job_name: 'blackbox'
    metrics_path: /probe
    params:
      module: [http_2xx]  # 模块对应 blackbox.yml
    static_configs:
      - targets:
        - http://baidu.com    # http
        - https://baidu.com   # https
        - http://xx.com:8080 # 8080端口的域名
    relabel_configs:
      - source_labels: [__address__]
        target_label: __param_target
      - source_labels: [__param_target]
        target_label: instance
      - target_label: __address__
        replacement: 127.0.0.1:9115  # blackbox安装在哪台机器
TCP
  - job_name: blackbox_tcp
    metrics_path: /probe
    params:
      module: [tcp_connect]
    static_configs:
      - targets:
        - 192.168.1.2:280
        - 192.168.1.2:7013

    relabel_configs:
      - source_labels: [__address__]
        target_label: __param_target
      - source_labels: [__param_target]
        target_label: instance
      - target_label: __address__
        replacement: 192.168.1.99:9115 # Blackbox exporter.
告警规则
可以从https://awesome-prometheus-alerts.grep.to/rules#blackbox这里找规则
# 以下两条二选一
groups:
  - name: http
    rules:
    - alert: xxx域名解析失败
      expr: probe_success{instance="https://xx.com"} == 0
      for: 1m
      labels:
        severity: "error"
      annotations:
        summary: "xxx域名解析失败"
    - alert: xxx域名解析失败
      expr: probe_http_status_code{instance="https://xx.com"} != 200
      for: 5m
      labels:
        severity: "error"
      annotations:
        summary: "xxx域名解析失败"
自定义模块
有时可能对于某些 URL 需要带参数,如 header、body 之类的,就需要自定义一个模块
blackbox.yml
  http_2xx_wxjj:
    prober: http
    timeout: 5s
    http:
      method: GET
      headers:
        Cookie: JSESSIONID=C123455dfdf
        sid: 41c912344555-24rkjkffd
        appid: 1221kj2h1k3hjk13hk
      body: '{}'
Prometheus.yml
  - job_name: 'blackbox_wxjl'
    metrics_path: /probe
    params:
      module: [http_2xx_wxjj]  # Look for a HTTP 200 response.
    static_configs:
      - targets:
        - http://192.168.201.173:808/byxxxxx/41234456661f-4357c9?head=APP_GeList&user=%E9%BB%84%E5%AE%15
   # Target to probe with http.

    relabel_configs:
      - source_labels: [__address__]
        target_label: __param_target
      - source_labels: [__param_target]
        target_label: instance
      - target_label: __address__
        replacement: 172.18.11.154:9115  # The blackbox exporter's real hostname:port.
开启 debug
当你觉得自己设置没错,http 状态码却返回不正确,想要调试一下,就需要打开debug。
- 启动时指定 –log.level=debug
- targets 后面带上 &debug=true,即 http://172.18.11.154:9115/probe?module=http_2xx_wxjj&target=http://192.168.201.173:808/byxxxxx/41234456661f-4357c9?head=APP_GeList&user=%E9%BB%84%E5%AE%15&debug=tru
targets 开启 debug 会比正常链接输出更多信息
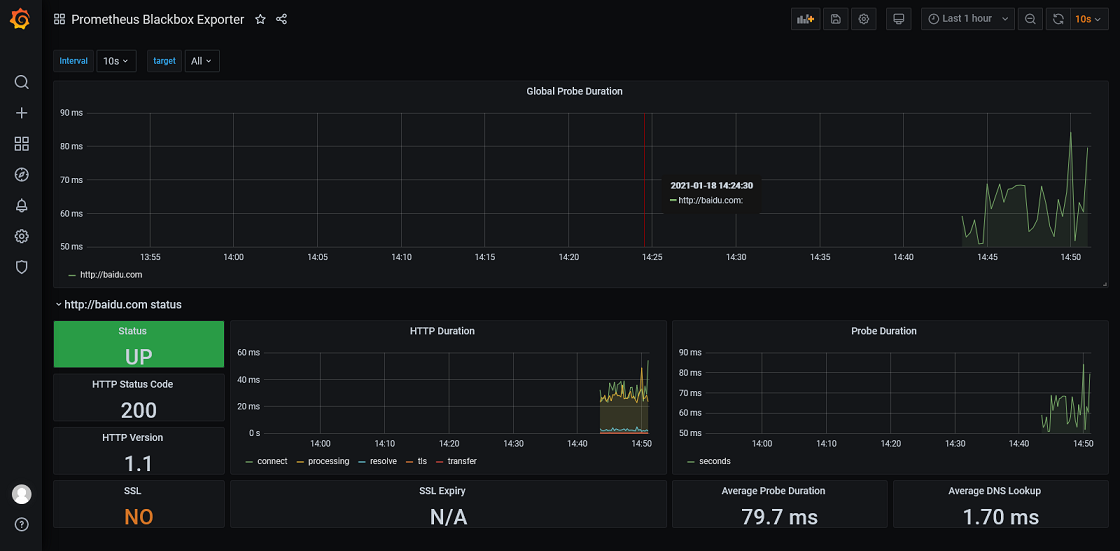
Grafana
id: 7587
2. MySQL
监控MySQL实例可以分为2种部署方式:
- 分离部署+环境变量
这种方式是在每个mysql服务器上跑一个exporter程序,比如10.10.20.14服务器上跑自己的mysqld_exporter,而登到10.10.20.15服务器上也启动自己的mysqld_exporter,也就是分离部署,这样的话每个mysql服务器上除了mysqld进程外还会多一个mysqld_exporter的进程。
- 集中部署+配置文件
如果我们想要保持mysql服务器零入侵的纯净环境,这时候就可以尝试一下集中部署+配置文件的方式。集中部署,就是说我们将所有的mysqld_exporter部署在同一台服务器上,在这台服务器上对mysqld_exporter进行统一的管理。
添加一个用户授权
# 建议设置对用户的最大连接数限制,以免在高峰期导致业务挂掉
CREATE USER 'exporter'@'localhost' IDENTIFIED BY '123456' WITH MAX_USER_CONNECTIONS 3;
GRANT PROCESS, REPLICATION CLIENT, SELECT ON *.* TO 'exporter'@'localhost';
使用环境变量启动
export DATA_SOURCE_NAME='exporter:123456@(localhost:3306)/'
nohup ./mysqld_exporter &
使用配置文件 my.cnf 启动
cat <<EOF> my.cnf
[client]
user=exporter
password=123456
EOF

nohup ./mysqld_exporter --config.my-cnf=my.cnf 2>&1 &
curl http://localhost:9104/metrics 即可访问到数据
添加到 Prometheus
 - job_name: 'mysqld'
   static_configs:
    - targets:
      - 192.168.159.131:9104
添加到 Grafana
ID: 7362

告警规则
https://awesome-prometheus-alerts.grep.to/rules#mysql
参考资料
https://github.com/prometheus/mysqld_exporter
3. Consul
启动
nohup ./consul_exporter --consul.server="http://localhost:8500" 2>&1 &
curl http://localhost:9107/metrics 即可访问到数据
添加到 Prometheus
 - job_name: 'consul'
   static_configs:
    - targets:
      - 192.168.159.131:9107
添加到 Grafana
ID: 13396
告警规则
https://awesome-prometheus-alerts.grep.to/rules#consul
参考资料
https://github.com/prometheus/consul_exporter
4. Redis
参考资料
https://github.com/oliver006/redis_exporter
5. Nginx
配置prometheus模块
lua_shared_dict prometheus_metrics 10M;
# 多个路径用;分隔,如lua_package_path "/server/nginx/lua/tracing/?.lua;/server/nginx/lua/prometheus/?.lua;;";
lua_package_path "/path/to/nginx-lua-prometheus/?.lua;;";
init_worker_by_lua_block {
  prometheus = require("prometheus").init("prometheus_metrics")
  metric_requests = prometheus:counter(
    "nginx_http_requests_total", "Number of HTTP requests", {"host", "status"})
  metric_latency = prometheus:histogram(
    "nginx_http_request_duration_seconds", "HTTP request latency", {"host"})
  metric_connections = prometheus:gauge(
    "nginx_http_connections", "Number of HTTP connections", {"state"})
}
log_by_lua_block {
  metric_requests:inc(1, {ngx.var.server_name, ngx.var.status})
  metric_latency:observe(tonumber(ngx.var.request_time), {ngx.var.server_name})
}
新增一个用于暴露指标的服务器配置文件
server {
  listen 9145;
  #allow 192.168.0.0/16;
  #deny all;
  location /metrics {
    content_by_lua_block {
      metric_connections:set(ngx.var.connections_reading, {"reading"})
      metric_connections:set(ngx.var.connections_waiting, {"waiting"})
      metric_connections:set(ngx.var.connections_writing, {"writing"})
      prometheus:collect()
    }
  }
}
reload 一下 Nginx,就可以去访问指标了
curl -s http://localhost:9145/metrics
# HELP nginx_http_request_duration_seconds HTTP request latency
# TYPE nginx_http_request_duration_seconds histogram
nginx_http_request_duration_seconds_bucket{host="localhost",le="00.005"} 13
nginx_http_request_duration_seconds_bucket{host="localhost",le="00.010"} 13
nginx_http_request_duration_seconds_bucket{host="localhost",le="00.020"} 13
nginx_http_request_duration_seconds_bucket{host="localhost",le="00.030"} 13
nginx_http_request_duration_seconds_bucket{host="localhost",le="00.050"} 13
nginx_http_request_duration_seconds_bucket{host="localhost",le="00.075"} 13
nginx_http_request_duration_seconds_bucket{host="localhost",le="00.100"} 13
nginx_http_request_duration_seconds_bucket{host="localhost",le="00.200"} 13
nginx_http_request_duration_seconds_bucket{host="localhost",le="00.300"} 13
nginx_http_request_duration_seconds_bucket{host="localhost",le="00.400"} 13
nginx_http_request_duration_seconds_bucket{host="localhost",le="00.500"} 13
nginx_http_request_duration_seconds_bucket{host="localhost",le="00.750"} 13
nginx_http_request_duration_seconds_bucket{host="localhost",le="01.000"} 13
nginx_http_request_duration_seconds_bucket{host="localhost",le="01.500"} 13
nginx_http_request_duration_seconds_bucket{host="localhost",le="02.000"} 13
nginx_http_request_duration_seconds_bucket{host="localhost",le="03.000"} 13
nginx_http_request_duration_seconds_bucket{host="localhost",le="04.000"} 13
nginx_http_request_duration_seconds_bucket{host="localhost",le="05.000"} 13
nginx_http_request_duration_seconds_bucket{host="localhost",le="10.000"} 13
nginx_http_request_duration_seconds_bucket{host="localhost",le="+Inf"} 13
nginx_http_request_duration_seconds_count{host="localhost"} 13
nginx_http_request_duration_seconds_sum{host="localhost"} 0
# HELP nginx_http_requests_total Number of HTTP requests
# TYPE nginx_http_requests_total counter
nginx_http_requests_total{host="localhost",status="200"} 12
nginx_http_requests_total{host="localhost",status="404"} 1
# HELP nginx_metric_errors_total Number of nginx-lua-prometheus errors
# TYPE nginx_metric_errors_total counter
nginx_metric_errors_total 8
添加到 Prometheus
  - job_name: 'nginx'
    static_configs:
    - targets:
      - 192.168.159.131:9145
添加到 Grafana
ID:10223、10442
参考资料
https://github.com/knyar/nginx-lua-prometheus
6. JVM
它是Prometheus官方组件,作为一个JAVA Agent来提供本地JVM的metrics,并通过http暴露出来。这也是官方推荐的一种方式,可以获取进程的信息,比如CPU和内存使用情况。
Jmx_exporter是以代理的形式收集目标应用的jmx指标,这样做的好处在于无需对目标应用做任何的改动。 运行JMX exporter的方式:
java XXX -javaagent:/root/jmx_exporter/jmx_prometheus_javaagent-0.14.0.jar=3010:/root/jmx_exporter/config.yaml -jar XXX.jar
这里的3010就是开启的端口,prometheus就需要配置这个端口来抓取数据
8. Kafka
默认情况下, Kafka metrics 所有的 metric 都可以通过 JMX 获取,暴露kafka metrics 支持两种方式
- 在 Kafka Broker 外部, 作为一个独立进程, 通过 JMX 的 RMI 接口读取数据. 这种方式的好处是有任何调整不需要重启 Kafka Broker 进程, 缺点是多维护了一个独立的进程。
- 在 Kafka Broker 进程内部读取 JMX 数据, 这样解析数据的逻辑就在 Kafka Broker 进程内部, 如果有任何调整, 需要重启 Broker。
我们选择第二种方式
下载agent.jar
https://search.maven.org/remotecontent?filepath=io/prometheus/jmx/jmx_prometheus_javaagent/0.14.0/jmx_prometheus_javaagent-0.14.0.jar
下载kafka.yml
https://github.com/prometheus/jmx_exporter/blob/master/example_configs/kafka-2_0_0.yml
修改kafka-server-start.sh
export JMX_PORT="9999"
export KAFKA_OPTS="-javaagent:/server/kafka/jmx_prometheus_javaagent-0.14.0.jar=9991:/server/kafka/kafka.yml"
启动kafka后访问 http://localhost:9991/mertrics可以看到各种指标
具体指标参考KAFKA相关文章
添加到 Prometheus
  - job_name: 'kafka'
    static_configs:
    - targets:
      - 192.168.159.131:9991
添加到 Grafana
ID有:7589,10466,11963,10555等等
9. Zookeeper
Zookeeper的方式与Kafka基本类似,我们还是采用agent的方式
下载zookeeper.yml
https://github.com/prometheus/jmx_exporter/blob/master/example_configs/zookeeper.yaml
修改zkServer.sh
export JMX_PORT="8999"
export JVMFLAGS="javaagent:/server/kafka/jmx_prometheus_javaagent-0.14.0.jar=9992:/server/kafka/zookeeper.yml $JVMFLAGS"
添加到 Grafana
ID:10607