Prometheus 最开始是由 SoundCloud 开发的开源监控告警系统,是 Google BorgMon 监控系统的开源版本。
在 2016 年,Prometheus 加入 CNCF,成为继 Kubernetes 之后第二个被 CNCF 托管的项目。随着 Kubernetes 在容器编排领头羊地位的确立,Prometheus 也成为 Kubernetes 容器监控的标配。
1. 设计架构
监控系统的总体架构大多是类似的,都有数据采集、数据处理存储、告警动作触发和告警,以及对监控数据的展示。
下面是 Prometheus 的架构:
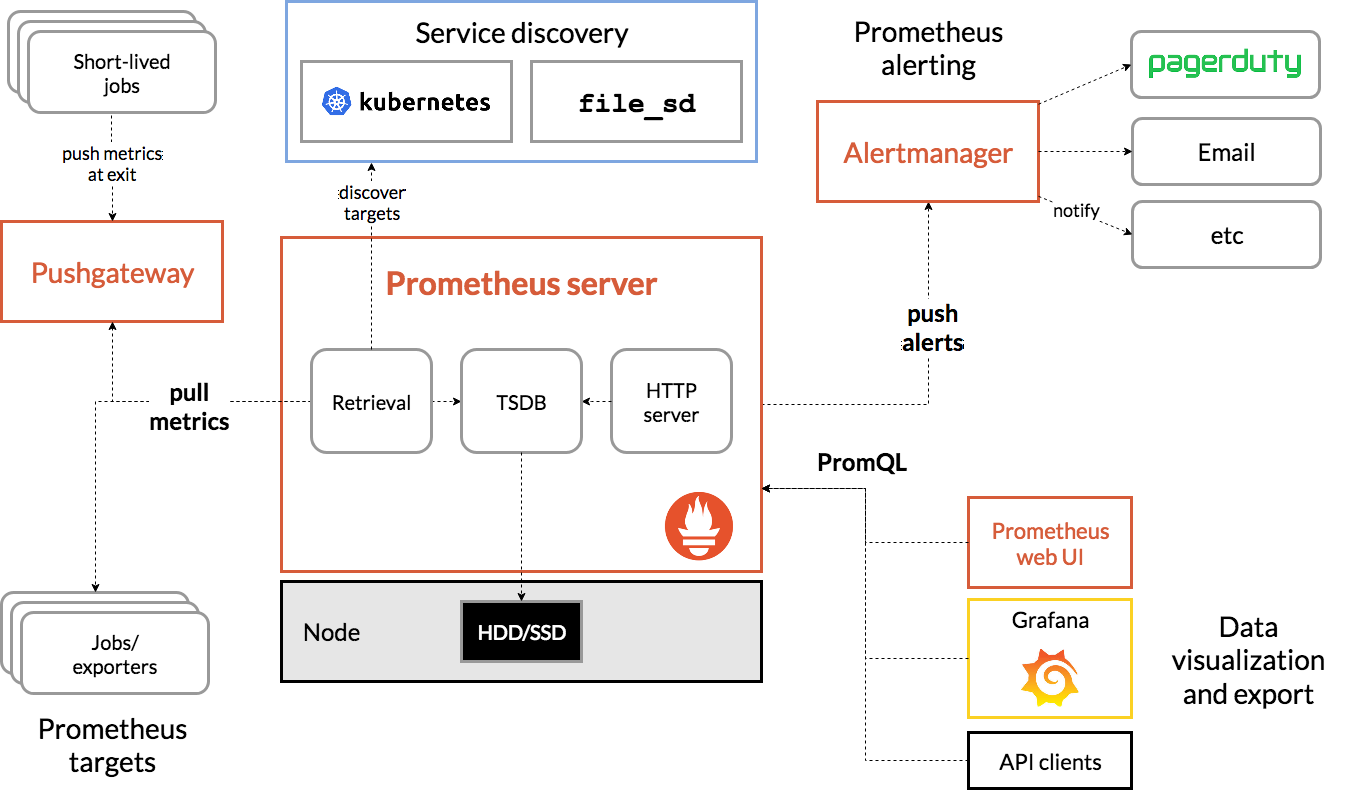
Prometheus Server 负责定时从 Prometheus 采集端 Pull(拉) 监控数据。Prometheus 采集端可以是实现了 /metrics 接口的服务,可以是从第三方服务导出监控数据的 exporter,也可以是存放短生命周期服务监控数据的 Pushgateway。相比大多数采用 Push(推) 监控数据的方式,Pull 使得 Promethues Server 与被采集端的耦合度更低,Prometheus Server 更容易实现水平拓展。
对于采集的监控数据,Prometheus Server 使用内置时序数据库 TSDB 进行存储。同时也会使用这些监控数据进行告警规则的计算,产生的告警将会通过 Prometheus 另一个独立的组件 Alertmanager 进行发送。Alertmanager 提供了十分灵活的告警方式,并且支持高可用部署。
对于采集到的监控数据,可以通过 Prometheus 自身提供的 Web UI 进行查询,也可以使用 Grafana 进行展示。
2. 部署Prometheus
2.1. 安装启动
直接到官网下载prometheus后解压
直接启动
# 默认存储路径是./data
./prometheus --config.file=prometheus.yml  -–storage.tsdb.path=/server/data/prometheus
也可以将prometheus放在/user/local/bin中
tar -zxvf prometheus-2.24.0.linux-amd64.tar.gz
cd prometheus-2.24.0.linux-amd64
cp prometheus promtool  /usr/local/bin/
prometheus --version
prometheus, version 2.24.0 (branch: HEAD, revision: 02e92236a8bad3503ff5eec3e04ac205a3b8e4fe)
  build user:       root@d9f90f0b1f76
  build date:       20210106-13:48:37
  go version:       go1.15.6
  platform:         linux/amd64

# 配置文件
mkdir -p /etc/prometheus
cp prometheus.yml /etc/prometheus/
promtool  check config /etc/prometheus/prometheus.yml
Checking /etc/prometheus/prometheus.yml
  SUCCESS: 0 rule files found

# 启动
prometheus --config.file=/etc/prometheus/prometheus.yml  --storage.tsdb.path=/server/data/prometheus
#开启配置文件热加载,Prometheus启动时在参数中加入--web.enable-lifecycle(该参数默认关闭),然后执行curl命令刷新配置

/prometheus --web.enable-lifecycle
curl -X POST http://IP:port/-/reload
2.2. 配置说明
global:
  scrape_interval:     15s # 设置抓取间隔,默认为1分钟
  evaluation_interval: 15s #估算规则的默认周期,每15秒计算一次规则。默认1分钟
  # scrape_timeout  #默认抓取超时,默认为10s

# Alertmanager相关配置
alerting:
  alertmanagers:
  - static_configs:
    - targets:
      # - alertmanager:9093

# 规则文件列表,使用'evaluation_interval' 参数去抓取
rule_files:
  # - "first_rules.yml"
  # - "second_rules.yml"

#  抓取配置列表
scrape_configs:
  - job_name: 'prometheus'
    static_configs:
    - targets: ['localhost:9090']
全局配置
配置的第一部分是 global,包含了控制 Prometheus 服务器行为的全局配置:
- 第一个参数 scrape_interval 用来指定应用程序或服务抓取数据的时间间隔。根据这个参数,Prometheus 将每隔15秒抓取数据。
- 第二个参数 evaluation_interval 用来指定 Prometheus 评估规则的频率。根据这个参数,Prometheus 将每隔15秒(重新)评估这些规则。目前主要有两种规则:记录规则(recording rule)和报警规则(alerting rule)。
记录规则:允许预先计算使用频繁且开销大的表达式,并将结果保存为一个新的时间序列数据。 报警规则:允许定义报警条件。
报警
配置的第二部分是 alerting,用来设置 Prometheus 的报警。报警是由名为 Alertmanager 的独立工具进行管理的。Alertmanager 是一个可以集群化的独立报警管理工具。
默认配置中,alerting 部分包含服务器的报警配置,其中 alertmanagers 块会列出 Prometheus 服务器使用的每个 Alertmanager。static_configs 块表示我们要手动指定使用 targets 数组中配置的 Alertmanager。在上述例子中,我们暂时没有定义 Alertmanager(注释掉了),因为目前并不需要特别定义一个 Alertmanager 来运行Prometheus。
规则文件
配置的第三部分是 rule_files,用来指定包含记录规则或报警规则的文件列表。这里暂时不使用。
抓取配置
配置的最后一部分是 scrape_configs,用来指定 Prometheus 抓取的所有目标。Prometheus 将它抓取的指标的数据源称为端点。为了抓取这些端点的数据,Prometheus 会定义目标,目标下会包含抓取数据所必需的的信息。若干目标构成的组称为作业。默认配置中定义了一个名为 prometheus 的作业,static_configs 参数列出了抓取的目标。prometheus 作业只配置了一个监控目标:Prometheus 自身服务器。它从本地的 9090 端口抓取数据并返回服务器的健康指标。
现在服务器已经开始运行了,我们可以通过 http://localhost:9090 浏览 prometheus 信息,我们还可以看看正在抓取的端点和一些原始的Prometheus指标。为此,我们可以浏览 http://localhost:9090/metrics 并查看返回的内容:
# HELP go_gc_duration_seconds A summary of the pause duration of garbage collection cycles.
# TYPE go_gc_duration_seconds summary
go_gc_duration_seconds{quantile="0"} 4.3934e-05
go_gc_duration_seconds{quantile="0.25"} 0.000131411
go_gc_duration_seconds{quantile="0.5"} 0.00025035
go_gc_duration_seconds{quantile="0.75"} 0.000640197
go_gc_duration_seconds{quantile="1"} 0.001776877
go_gc_duration_seconds_sum 0.010177347
go_gc_duration_seconds_count 21
# HELP go_goroutines Number of goroutines that currently exist.
# TYPE go_goroutines gauge
go_goroutines 35
# HELP go_info Information about the Go environment.
# TYPE go_info gauge
go_info{version="go1.15.6"} 1
# HELP go_memstats_alloc_bytes Number of bytes allocated and still in use.
# TYPE go_memstats_alloc_bytes gauge
go_memstats_alloc_bytes 2.8245016e+07
# HELP go_memstats_alloc_bytes_total Total numb
...
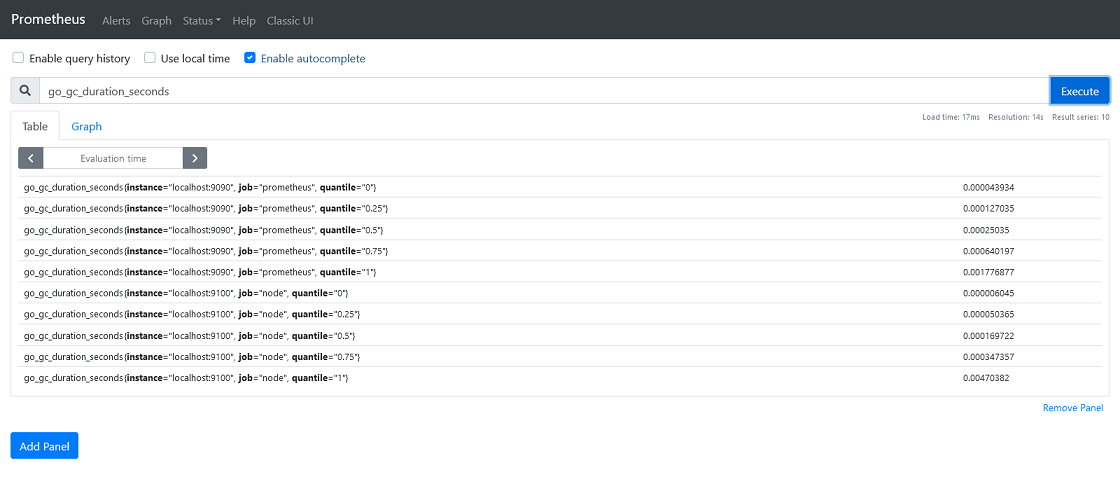
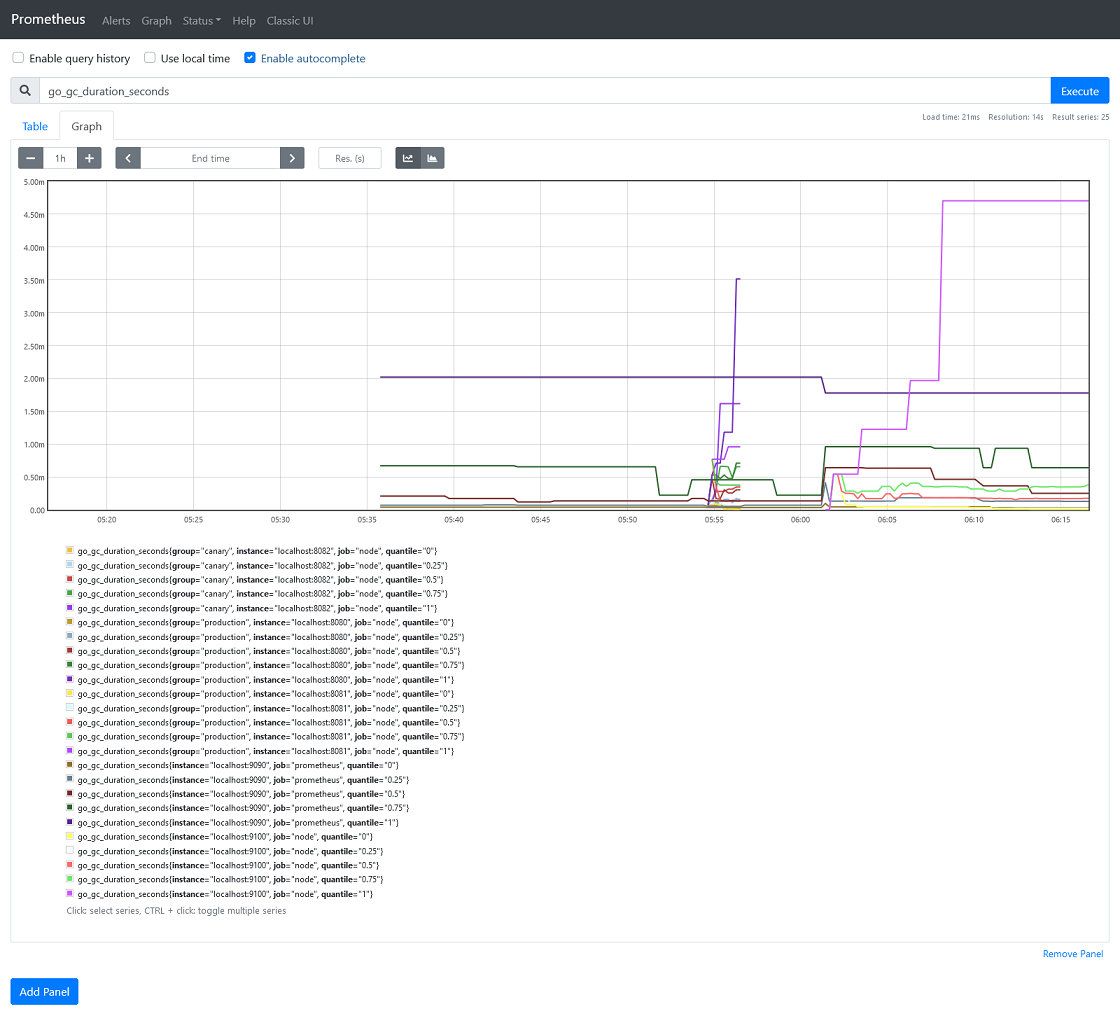
2.3. 表达式浏览器
由于上述查看指标的方式对用户不是很友好,所以我们可以使用 Prometheus 的内置表达式浏览器来查看,例如我们使用表达式浏览器找出 go_gc_duration_seconds 指标。我们可以在查询框中键入指标名称,然后单击 Execute 按钮得到具有这个名称的所有指标。这将返回多个不同的时间序列以及每个时间序列记录的最新值,所有时间序列均具有度量名称 go_gc_duration_seconds,但具有不同的 quantile 标签。
2.4. 使用systemd来启停Prometheus
vim /etc/systemd/system/prometheus.service
[Unit]
Description=Prometheus
Documentation=https://prometheus.io/
After=network.target
[Service]
Type=simple
User=prometheus
ExecStart=/usr/local/bin/prometheus --config.file=/etc/prometheus/prometheus.yml --storage.tsdb.path=/server/data/prometheus
Restart=on-failure
[Install]
WantedBy=multi-user.target
3. Grafana
虽然说prometheus能展示一些图表,但对比Grafana,那只是个过家家。接下来我们需要在同一个服务器上安装Grafana服务,用来展示prometheus收集到的数据。
3.1. 安装启动
wget https://dl.grafana.com/oss/release/grafana-7.3.6.linux-amd64.tar.gz
tar -zxvf grafana-7.3.6.linux-amd64.tar.gz
Grafana需要使用grafana用户启动,所以我们先创建grafana用户
useradd -s /sbin/nologin -M grafana
mkdir /server/data/grafana
mkdir -p /server/logs/grafana
chown -R grafana:grafana /server/grafana-7.3.6
chown -R grafana:grafana /server/data/grafana
chown -R grafana:grafana /server/logs/grafana
修改配置文件conf/defaults.ini,指定数据目录
data = /server/data/grafana
logs = /server/logs/grafana
plugins = /server/data/grafana/plugins
provisioning = /server/data/grafana/conf/provisioning
默认情况下,grafana-server会启动3000端口,我们使用浏览器打开grafana页面,然后输入默认的账号密码 admin/admin登录。
3.2. 添加数据源
grafana虽然已经安装好了,但是这个时候还没有数据,没办法作图。下面我们把grafana和prometheus关联起来,也就是在grafana中添加添加数据源。在配置页面点击添加数据源,然后选择prometheus,输入prometheus服务的参数即可。

3.3. 添加自带的示例图表
按照上面的指导添加数据源之后,我们就可以针对这些数据来绘制图表了。grafana最人性化的一点就是拥有大量的图表模板,我们只需要导入模板即可,从而省去了大量的制作图表的时间。 目前我们的prometheus还没有什么监控数据,只有prometheus本身的数据,我们看下这些prometheus本身数据图表是怎样的。 在添加数据源的位置上,右边的选项有个Dashboards的菜单选项,我们点击进去,然后导入prometheus2.0.

最后我们在左上角的位置上选择这个图表查看。

3.3. 使用systemd来启停Grafana
vim /etc/systemd/system/grafana-server.service
[Unit]
Description=Grafana
After=network.target

[Service]
User=grafana
Group=grafana
Type=notify
ExecStart=/server/grafana-7.3.6/bin/grafana-server -homepath /server/grafana-7.3.6
Restart=on-failure

[Install]
WantedBy=multi-user.target
4. 使用Node Exporter测试
prometheus-server就像是mysql,负责存储数据。只不过这是时序数据库而不是关系型的数据库。数据的收集还需要其他的客户端,在prometheus中叫做exporter。针对不同的服务,有各种各样的exporter,就好比zabbix的zabbix-agent一样。
这里为了能够采集到主机的运行指标如CPU, 内存,磁盘等信息。我们可以使用Node Exporter。Node Exporter同样采用Golang编写,并且不存在任何的第三方依赖,只需要下载,解压即可运行。可以从https://prometheus.io/download/获取最新的node exporter版本的二进制包。
下载node_exporter-1.0.1.linux-amd64.tar.gz并解压
# 默认端口是9100
nohup ./node_exporter >/dev/null 2>&1 &
#nohup ./node_exporter --web.listen-address 127.0.0.1:8080 >/dev/null 2>&1 &
配置Prometheus,收集node exporter的数据
可以看到node exporter启动后也就是暴露了9100端口,并没有把数据传到prometheus,我们还需要在prometheus中配置,让prometheus去pull这个接口的数据。
编辑prometheus.yml文件,增加后面4行.
scrape_configs:
  # The job name is added as a label `job=<job_name>` to any timeseries scraped from this config.
  - job_name: 'prometheus'

    # metrics_path defaults to '/metrics'
    # scheme defaults to 'http'.

    static_configs:
    - targets: ['localhost:9090']
  #采集node exporter监控数据
  - job_name: 'node'
    static_configs:
    - targets: ['localhost:9100']
然后重启prometheus,打开prometheus页面查看是不是有对应的数据了
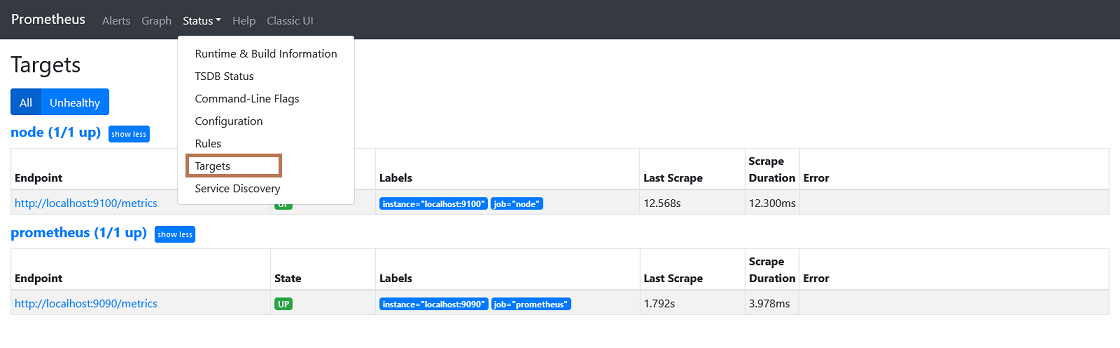
在prometheus的web界面看到这个节点是up的状态了,接下来我们在grafana中添加对应的模板。
在Grafana导入界面,我们输入模板的编号,这里我使用的是1860号模板,如要使用其他的模板,请到官网https://grafana.com/dashboards
选择数据源,然后点击导入
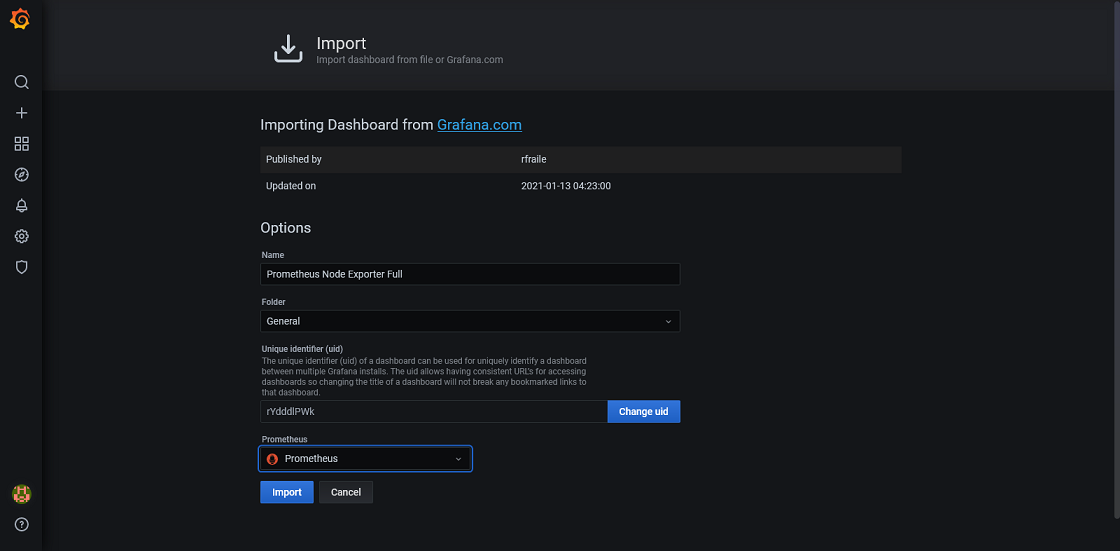
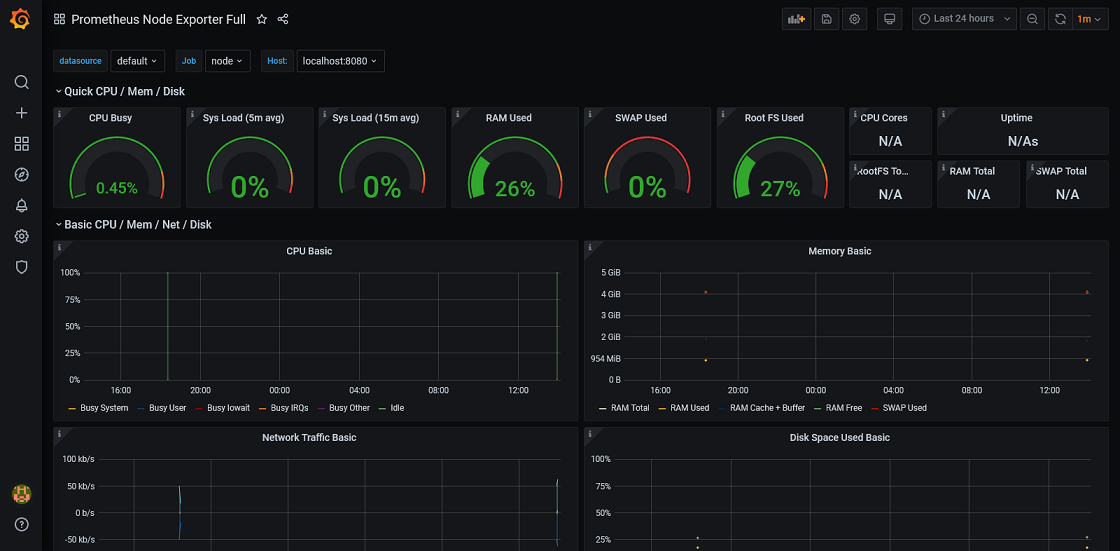
然后你就可以看到下面一个的界面了。
5. 优缺点
优点
- 多维度的数据模型:时序数据由指标(metric)名称和标签对标识
- 提供灵活的数据查询语言 –PromQL
- 同时支持监控数据的本地存储和远程存储
- 同时支持静态文件配置和动态发现监控对象
- 易于和结合 Grafana 等 GUI 组件展示数据
- 与 Kubernetes 相融合
任何工具都没有银弹,Prometheus 也不例外,它有自身的局限性:
- 它只能采集某个 metric 的数值,所以它能监控某个调用的执行时间,但是不能还原整个调用链。
- Prometheus 本地存储的设计初衷是存储短期的数据(通常是一个月),所以对于需要存储大量的历史数据的场景需要使用如 OpenTSDB 这样的远端存储。
- Prometheus 的监控数据没有对单位进行定义,通常需要使用约定好的默认单位或者在 metric 的命名中加上单位。
6. 参考资料
https://mp.weixin.qq.com/s/8iEnsFXVJEnu3a2yFvd5PQ
爱可生开源社区-《第01期:详解 Prometheus 专栏开篇》 (地址忘了)